

 We typically respond the same day

TL;DR: HubSpot website analytics gives your team the data to connect traffic behavior to pipeline outcomes. Track these metrics monthly: sessions, source breakdowns, bounce rate, landing page conversions, CTA click rates, form submissions, and contact attribution. Each one feeds directly into RevOps and CRM reporting.
If your team pulls HubSpot reports only when someone asks "how's the website doing?", you're already behind. Monthly analytics reviews are how RevOps teams catch revenue leaks before they become revenue loss.
This guide covers the metrics that matter, why each one earns its place in your monthly reporting cycle, and how they connect to CRM data and pipeline decisions.
Why HubSpot website analytics reporting matters for B2B teams
HubSpot CMS reporting sits at the intersection of marketing performance and revenue outcomes. Unlike standalone analytics tools, HubSpot ties website behavior directly to contact records, deal stages, and lifecycle stage movement. That connection is what makes the data actionable rather than decorative.
HubSpot website analytics tracks sessions, traffic sources, conversions, and contact behavior inside the same platform where your CRM data lives. That means a RevOps leader can trace a contact from first page visit through deal close without stitching together data from three different tools.
The metrics below are organized by what they measure and why they belong in a monthly review. If you want a broader understanding of how HubSpot's reporting and dashboards tool works before diving in, that's a useful starting point.
What HubSpot website analytics metrics should your team track monthly?
1. Total sessions and session trends
HubSpot tracks sessions as unique website visits within a defined time period.
Sessions give you the baseline. They tell you whether your site is gaining or losing audience over time, and whether seasonal dips are expected or worth investigating. A month where sessions drop 20% against a flat ad spend is a signal worth chasing.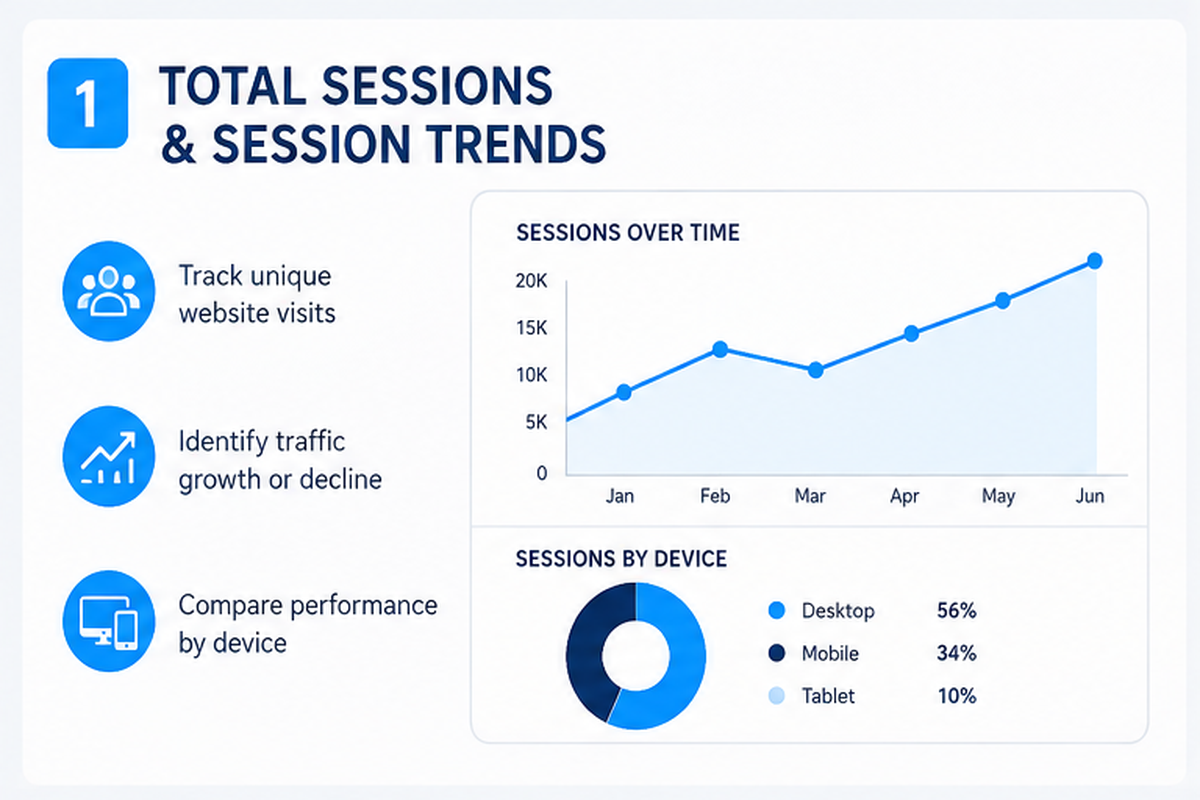
Track sessions broken out by device type too. Mobile sessions that convert at half the rate of desktop sessions point to a UX problem, not a traffic problem.
Key Points:
- Total sessions measure unique visits per reporting period.
- Session trends reveal traffic growth or decline over time.
- Device breakdowns surface conversion gaps between mobile and desktop.
2. Traffic source breakdown
HubSpot traffic analytics segments sessions by organic search, direct, referral, social, email, and paid.
Source data tells you where your audience comes from and which channels are pulling their weight. A site that's 80% dependent on one source has a fragility problem. A source that's growing fast deserves more budget attention. A referral spike you can't explain often traces back to a new backlink or a mention in a newsletter.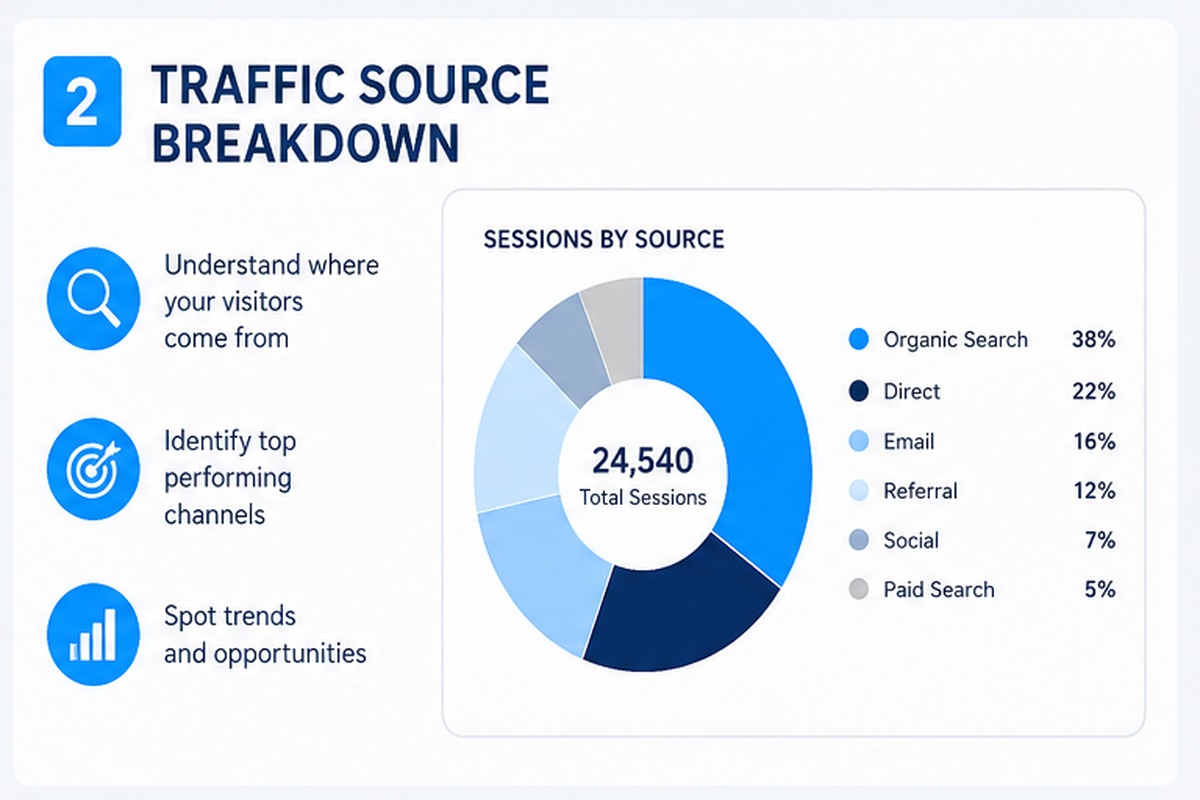
For B2B teams, organic and email tend to be the highest-intent sources. Paid traffic that doesn't convert at a higher rate than organic is usually an efficiency problem worth reviewing with the RevOps lead.
Key Points:
- Organic search delivers high-intent visitors actively researching solutions.
- Email traffic generates repeat visits from known contacts in your CRM.
- Referral spikes often indicate new backlink acquisition or earned media.
3. Bounce rate by page
Bounce rate in HubSpot measures the percentage of single-page sessions with no further interaction.
A high bounce rate on a blog post is often fine. A high bounce rate on a pricing page or a HubSpot services landing page is a problem. The key is reading bounce rate in context, not in aggregate.
Pages where visitors bounce at high rates after arriving from paid campaigns are the most expensive kind of underperformance. Those conversions cost money. Tracking bounce by traffic source and landing URL together surfaces where to focus copy or layout improvements.
Key Points:
- Bounce rate measures single-page visits with no further interaction.
- High bounce on conversion pages signals messaging or UX friction.
- Paid traffic with high bounce rates indicate wasted campaign spend.
4. Landing page conversion rates
HubSpot landing page analytics tracks submissions, conversion rates, and view-to-submission ratios for each page.
Landing pages are where traffic becomes pipeline. Conversion rate is the single most important number on any page that carries a form. A page with 500 views and a 2% conversion rate is generating 10 leads. The same page at 5% generates 25. That's not a traffic problem. That's a conversion problem.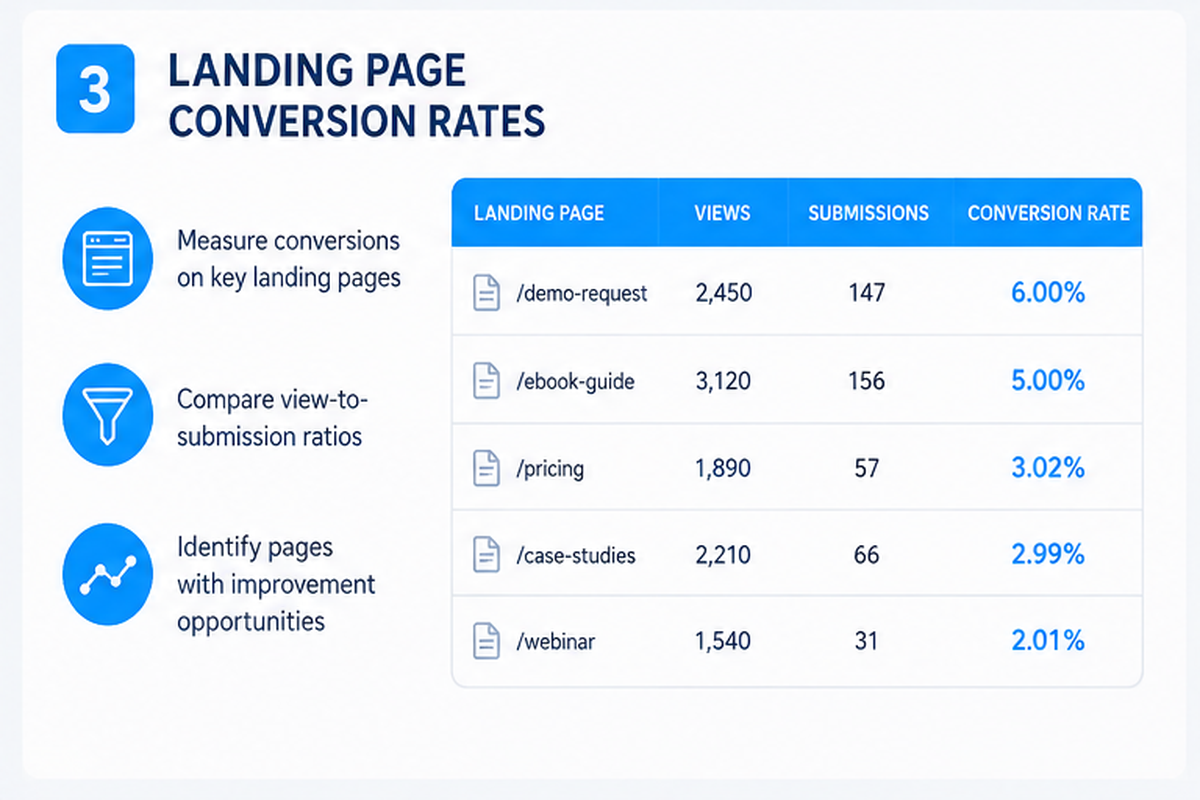
HubSpot lets you compare landing page performance across campaigns and time periods. If you built your funnel inside HubSpot and want to understand what drives conversions, the HubSpot tutorials from webdew cover practical setup steps that most teams skip.
Key Points::
- Landing page conversion rate measures form submissions divided by total page views.
- View-to-submission ratios compare page performance across campaigns.
- Declining conversion rates signal copy, offer, or form friction issues.
5. CTA click-through rates
HubSpot CTA analytics measures click-through rate for each call-to-action module placed across your site.
CTAs are the connective tissue between content and conversion. A blog post with strong traffic but a 0.3% CTA click rate is generating reads, not leads. Monthly CTA reporting tells you which offers are resonating and which are being ignored.
HubSpot tracks CTA performance at the individual level, so you can compare button copy, placement, and design variants across pages. The data aggregates into the broader HubSpot CMS reporting view, making it easy to roll up CTA performance in a monthly dashboard review.
Key Points:
- CTA click-through rate measures clicks as a percentage of total CTA views.
- Low CTA performance on high-traffic pages indicates offer-message mismatch.
- CTA data rolls up into HubSpot dashboard reporting for monthly review.
6. Form submission volume and source
HubSpot form analytics tracks submission volume, submission source, and contact creation from each form.
Forms are the most direct revenue signal in HubSpot website analytics. Every submission creates or updates a contact record. Tracking form volume monthly tells you whether your top-of-funnel is growing or contracting.
Source attribution on form submissions is where this connects directly to RevOps. If 60% of form submissions come from organic search but that source only gets 10% of the marketing budget, that's a resource allocation conversation. HubSpot's attribution data makes that conversation factual rather than anecdotal..png?width=1200&height=800&name=hubspot-analytics-form-submissions%20(1).png)
Key Points:
- Form submission volume measures total contact creation events per period.
- Source attribution links form submissions to specific traffic channels.
- Submission trends signal top-of-funnel growth or contraction over time.
7. New vs. returning visitor ratio
HubSpot analytics segments visitors as new or returning based on browser cookie tracking.
This ratio tells you whether your site is pulling in new audiences or mostly re-engaging the same visitors. For B2B SaaS companies in a growth phase, a high new visitor percentage is expected and healthy. For a company focused on customer expansion, a growing returning visitor percentage may indicate product engagement.
The ratio also informs content strategy. If returning visitors are high, your audience is coming back for a reason. If new visitors consistently fail to convert on first touch, your nurture sequences and retargeting need attention.
Key Points::
- New visitor percentage measures first-time audience acquisition over time.
- Returning visitors indicate repeat engagement with existing contacts or customers.
- Visitor ratio informs content investment between acquisition and retention.
8. Session-to-contact conversion rate
HubSpot contact attribution connects website sessions to contact record creation in the CRM.
This is the metric that connects website performance to CRM health. Session-to-contact rate measures how effectively your site converts anonymous traffic into known contacts. It's the bridge between marketing analytics and RevOps reporting.
Low session-to-contact rates despite strong traffic usually point to one of three problems: CTAs aren't compelling, landing pages aren't converting, or traffic quality is low. HubSpot's attribution tools help isolate which.
If you're new to how HubSpot connects these data points, what HubSpot actually is and how it works gives helpful context before you build out your reporting.
Key Points:
- Session-to-contact rate measures anonymous traffic converted to CRM records.
- Low conversion rates indicate CTA, landing page, or traffic quality issues.
- Contact attribution connects marketing website data to RevOps pipeline reporting.
9. Pages per session and average session duration
HubSpot engagement analytics measures how many pages visitors view and how long they spend on the site per session.
Depth of engagement predicts intent. A visitor who reads three blog posts and visits the pricing page in one session is closer to a conversation than someone who reads one post and leaves. Pages per session and session duration together give you a proxy for content effectiveness.
This data also informs content strategy. If posts on a specific topic consistently generate longer sessions and more pages per visit, that cluster is resonating and worth expanding.
Key Points:
- Pages per session measures content depth engagement across a single visit.
- Session duration correlates with visitor intent and content relevance.
- High engagement from specific topics signals content cluster expansion opportunities.
How to build a monthly HubSpot analytics review
A useful monthly review takes less than an hour if the dashboards are already built. Pull the nine metrics above into a single HubSpot dashboard. Set comparison periods to the prior month and the same month last year. Flag anything that moved more than 15% in either direction.
Then connect the dots to pipeline. Sessions are up but contact creation is flat? Conversion problem. Contact creation is up but deal velocity is slow? Sales handoff problem. CRM and website data living in the same platform is the structural advantage HubSpot gives RevOps teams. Use it.
What this looks like in practice: webdew worked with Obsidian Insurance Holdings to rebuild their HubSpot reporting from the ground up. Before the engagement, their teams tracked key dates manually, deal stages lacked consistency, and reports gave limited pipeline visibility. webdew configured 5 custom dashboards and 25 tailored reports tied to Obsidian's specific KPIs, all delivered in 10 days. Sales and operations teams went from fragmented data to real-time deal tracking without adding headcount to the reporting process.
For teams building this reporting layer from scratch, webdew has worked with dozens of B2B SaaS companies to set up HubSpot analytics that connect directly to revenue reporting. Start with the metrics above and build from there.
Ready to build HubSpot analytics dashboards that connect website performance to pipeline data? webdew works with B2B SaaS companies to implement and optimize HubSpot reporting. Let's talk about your setup.
Dive Into our
Client Testimonials
Listen to business owners like you share how we’ve helped them grow. Your story could be next!





.svg)

“Recently we reached out to Webdew for a website inside of HubSpot and they also did some mocking automation for us.”

“Webdew team was quite honest and quite easy to work with in terms of taking feedback implementing it, showing that it doesn’t happen again and things like making sure that it meets our expectations.”

“We worked with webdew to help us build our HubSpot website and they did an amazing job with it. They were very quick.”

“webdew has helped us optimize the sales and marketing processes, and this is automating a lot of processes.”

“Hi everyone my name is Kara and I work as a channel consultant at HubSpot Singapore. I’ve been working closely with webdew agency”

“Hi my name is Christian from OpenDoors Mortgage team and I’m in the mortgage business and just trying to work on new projects and kind of incorporating HubSpot for my operations”

“I’m one of the technology directors for Travelopia. We are the largest experiential travel company in the world. We’ve engaged webdew recently, not recently, it’s been about a couple of quarters now.”
“We worked with Chehak over the past several months to create a series of animated videos for an academic planner that we produce. And from the very beginning, she was absolutely professional and a pleasure to work with.”


6x
We helped clients multiply their website conversion rates through strategic design and UX optimization.
20%
Our marketing campaigns led to a 20% uplift in customer engagement across digital channels.
2K+
Delivered over 2,000 qualified leads through targeted funnels and smart automation.
120+
Our video content has earned 120,000+ views, driving brand awareness and audience retention.
“I recently had the pleasure of working with Chehak on a video demo project, and I was thoroughly impressed with her services.”
.svg)

Additional Resources
Access expert tips, trends, and strategies designed for small businesses. Stay ahead of the curve and make informed decisions with our comprehensive resources!