


 We typically respond the same day

You bought HubSpot to grow revenue. But three months after go-live, half your team logs in once a week, your lifecycle stages look like a junk drawer, and churn keeps ticking upward. Sound familiar?
The missing piece is measurement. Nobody tracked whether onboarding actually changed customer behavior. And without that data, you can't connect CRM adoption to the retention numbers your board cares about.
This post covers how B2B SaaS teams can track whether their HubSpot onboarding moved the needle on customer retention, using adoption data, lifecycle signals, and churn metrics that already live inside your CRM.
Why onboarding is the first retention lever
Most B2B SaaS companies treat onboarding as a setup task: import contacts, configure pipelines, train the team, move on. That framing misses the point. Onboarding sets the ceiling for everything your CRM can do afterward: lifecycle management, automation, reporting accuracy, and the handoff between marketing, sales, and customer success.
When HubSpot onboarding is done well, teams adopt the platform faster, data stays clean, and customer success managers can actually see which accounts are at risk. When it's done poorly, teams revert to spreadsheets within weeks, and your customer relationship management system becomes an expensive address book.
According to Bain & Company, increasing customer retention by just 5% can boost profits by as much as 95%. For B2B SaaS companies running on tight unit economics, that number changes the math on every dollar spent on CRM platform services and onboarding.
Step 1: Define your retention baseline before onboarding
You can't measure impact without a starting point. Before you reconfigure a single property in HubSpot, pull these numbers from your existing data:
Gross revenue retention (GRR): The percentage of recurring revenue retained from existing customers, excluding expansion. This tells you how much revenue walks out the door each period.
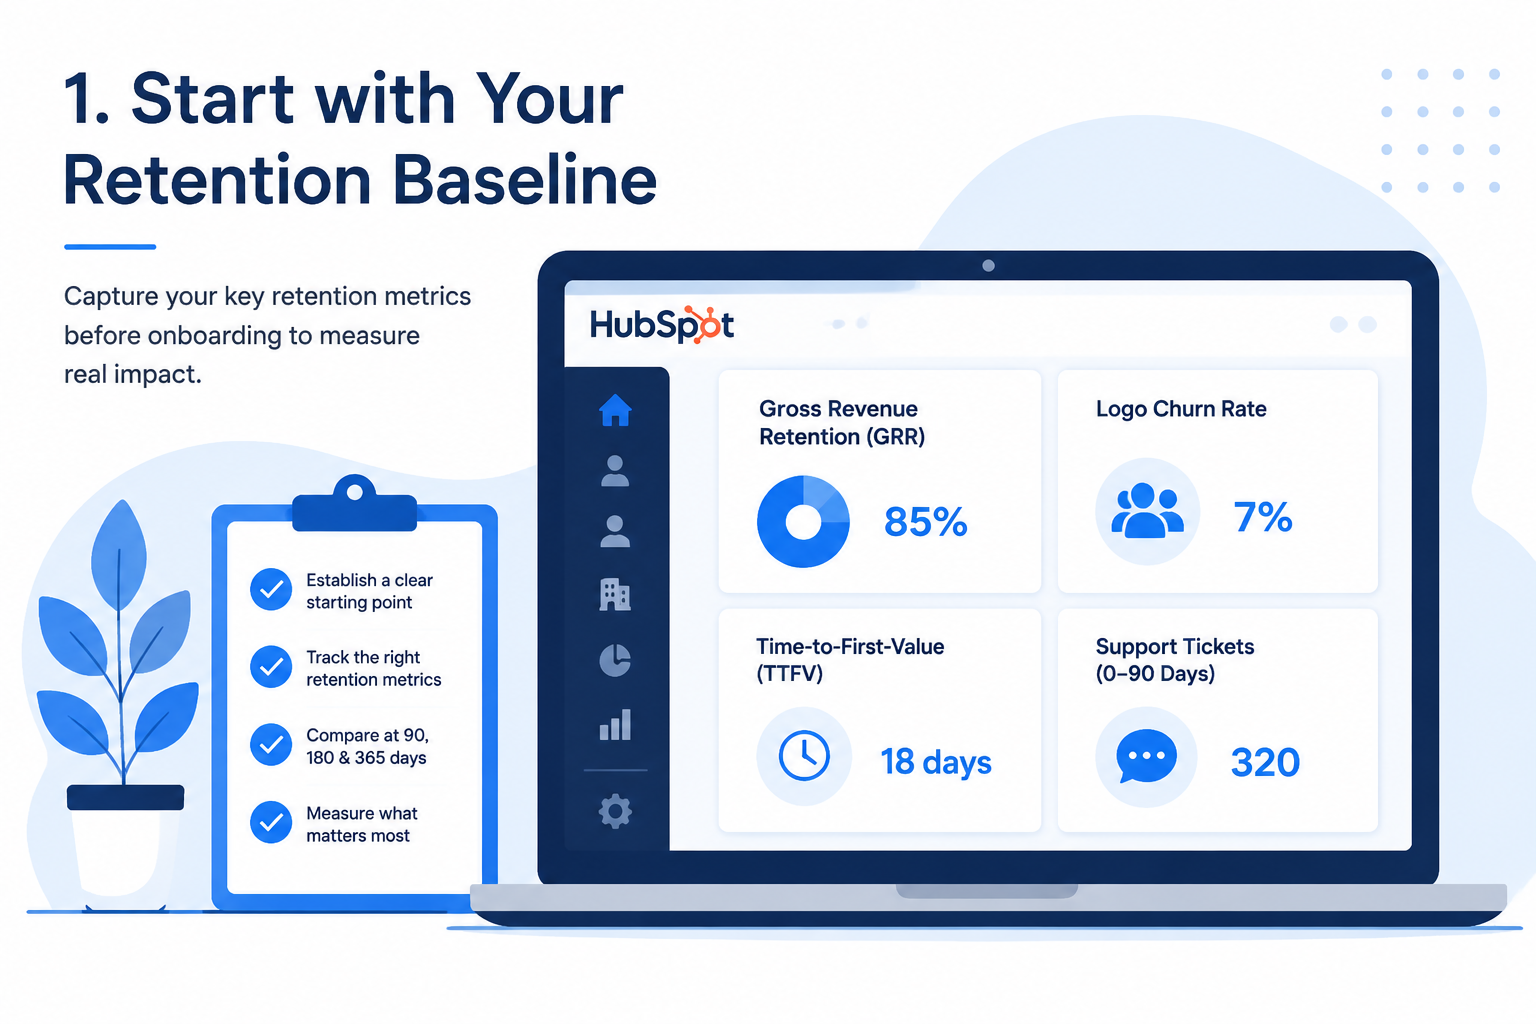
Logo churn rate: The percentage of customer accounts lost in a given period. GRR and logo churn often tell different stories. You might retain revenue through upsells while still losing smaller accounts.
Time-to-first-value (TTFV): How long it takes a new customer to reach their first meaningful outcome after purchase. If you're not tracking this yet, onboarding is the right time to start.
Support ticket volume by lifecycle stage: Are customers in their first 90 days filing more tickets than mature accounts? Spikes here signal onboarding gaps in your product or your CRM workflows.
Document these numbers with a date stamp. You'll compare against them at 90, 180, and 365 days post-onboarding.
Step 2: Track CRM adoption metrics inside HubSpot
Adoption is the leading indicator of retention impact. If your team doesn't use HubSpot consistently, the downstream data falls apart. Lifecycle stages go stale, deal progression stops reflecting reality, and customer health scores lose meaning.
Here's what to track weekly for the first 90 days after onboarding:
Daily active users (DAU) by team. HubSpot's usage logs show who's logging in and what they're doing. If your sales team hits the CRM twice a week while customer success logs in daily, that gap will show up in your retention data later.
Contact and company record completeness. Missing data creates blind spots. After onboarding, measure the percentage of required fields populated across contacts, companies, and deals. Anything below 80% signals incomplete adoption.
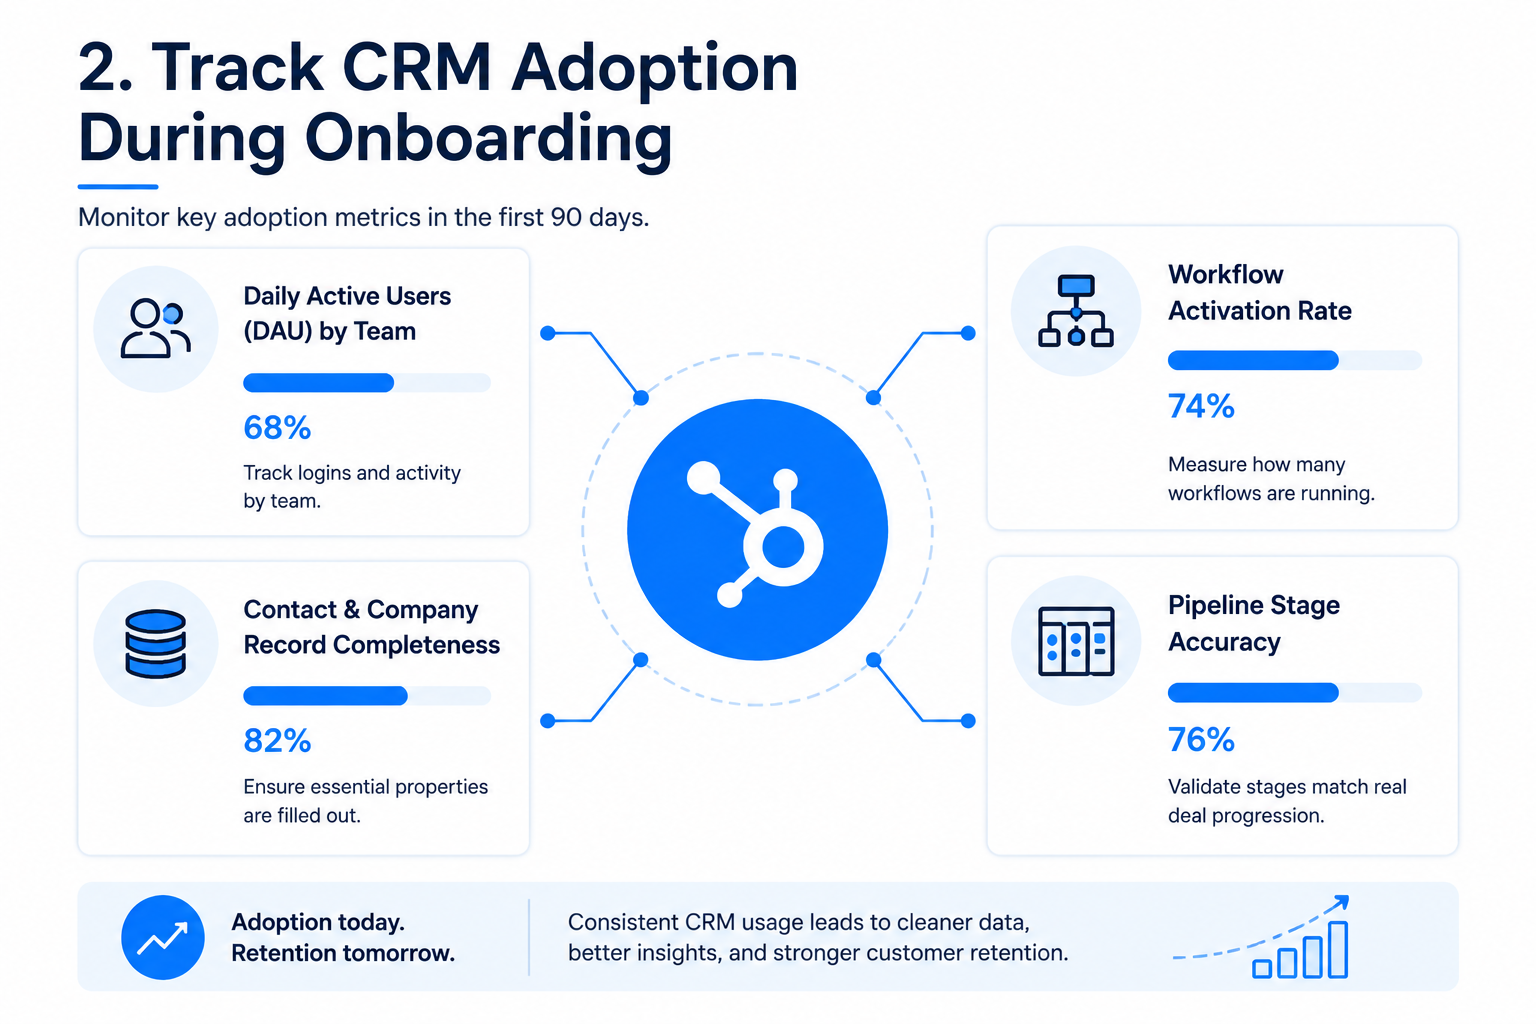
Workflow activation rate. How many of the workflows built during onboarding are actually running? A workflow that exists but never triggers tells you the team either doesn't trust it or doesn't understand it.
Pipeline stage accuracy. Compare deal stages in HubSpot to what reps report in meetings. If those two stories don't match, your CRM data isn't reliable enough to predict churn.
Companies running HubSpot onboarding for SaaS should build a simple dashboard tracking these four metrics from day one. The dashboard itself becomes a retention tool because it gives leadership visibility into whether the CRM investment is landing.
Step 3: Map lifecycle data to churn signals
CRM platforms for B2B SaaS customer retention only work when lifecycle stages reflect real customer behavior. This is where most teams fall short after onboarding.
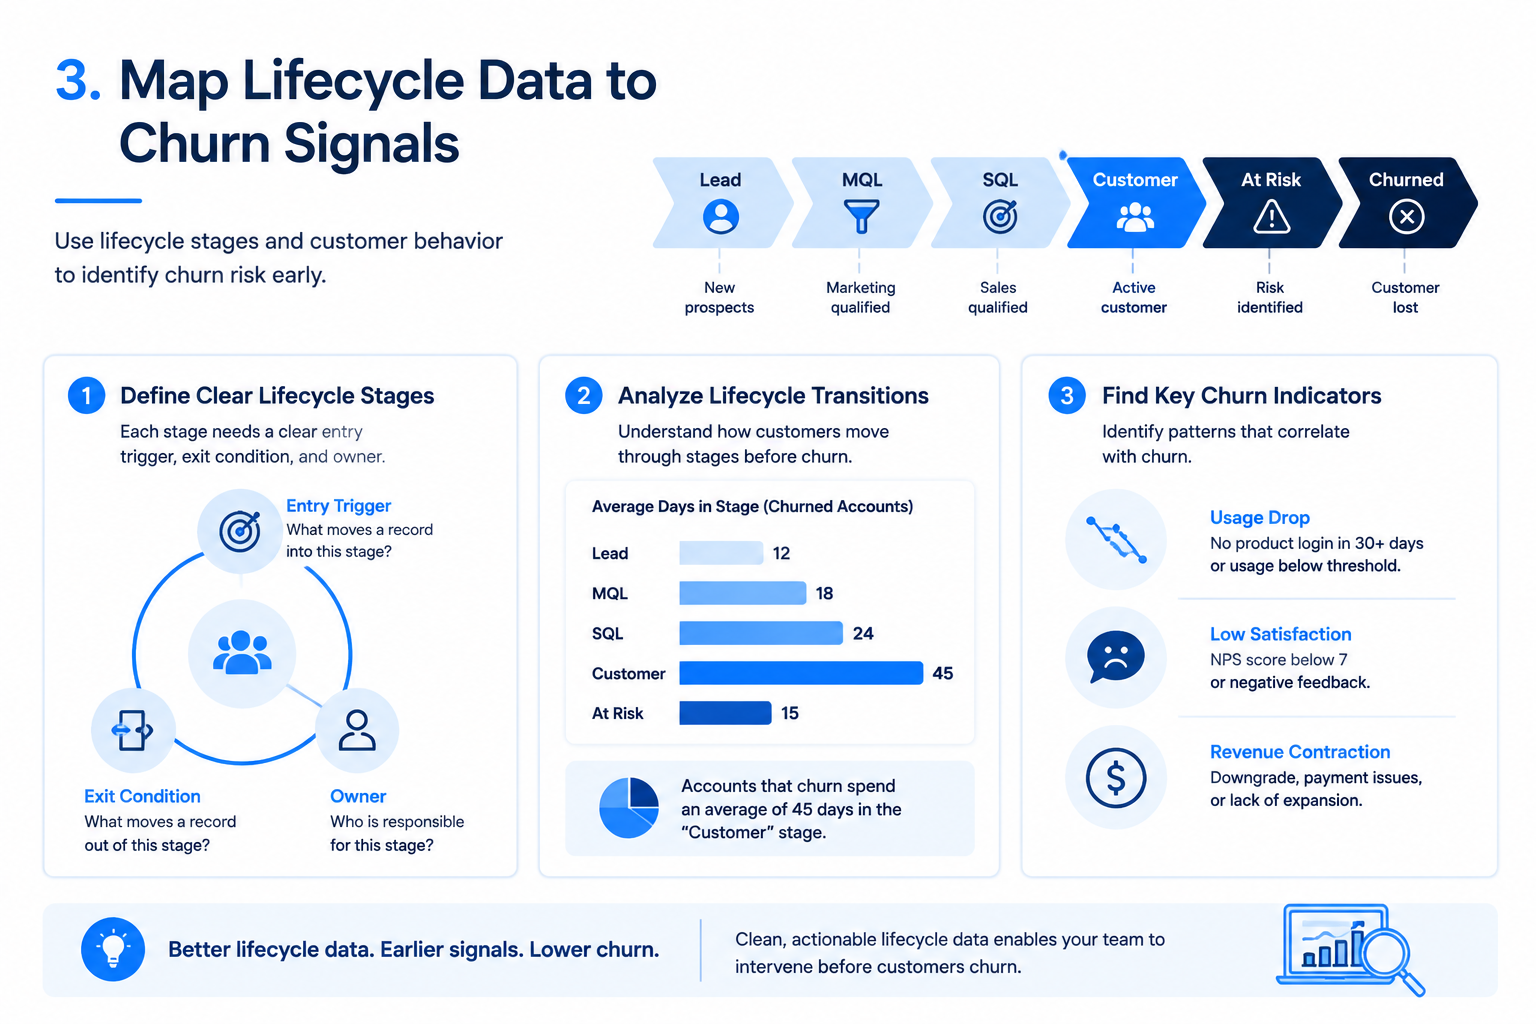
Start by auditing your lifecycle stage definitions. Each stage should have:
A clear entry trigger. "Marketing Qualified Lead" means a contact scored above 50, not "someone we think looks good." Remove ambiguity.
A measurable exit condition. Contacts move from "Customer" to "At Risk" when specific conditions are met: no product login in 30 days, a drop in usage below a threshold, or an NPS score below 7.
An assigned owner. Every lifecycle stage needs a team responsible for the contacts in it. Unowned stages are where accounts go to churn quietly.
Once your lifecycle stages are clean, build HubSpot reports that answer these questions:
How long do customers spend in each lifecycle stage before churning? If accounts that churn spend an average of 45 days in the "Customer" stage before going silent, you've found your intervention window.
Which lifecycle transitions correlate with retention? Customers who move from "Customer" to "Advocate" (measured by referrals, case study participation, or expansion revenue) churn at a fraction of the rate of customers who stay static.
What percentage of churned accounts had incomplete onboarding? Cross-reference your churned accounts against your onboarding completion data. If 60% of churned accounts never finished their CRM setup, onboarding quality is your churn reduction lever.
Step 4: Build a retention scorecard
Pull your adoption metrics and lifecycle data into a single retention scorecard. Keep it tight: five to seven numbers, reviewed monthly by your RevOps and customer success leadership.
A practical scorecard includes:
CRM adoption score. A composite of DAU, record completeness, and workflow activation, weighted by team. Customer-facing teams carry more weight because their adoption directly affects retention.
Lifecycle velocity. The average time customers spend moving through lifecycle stages. Faster progression from "New Customer" to "Engaged" predicts higher retention.
Churn cohort comparison. Compare the churn rate of customers onboarded after your HubSpot implementation against the pre-onboarding cohort. Control for contract value and industry vertical to isolate the onboarding effect.
Net revenue retention (NRR). Track expansion revenue alongside churn to see whether better customer success management, enabled by cleaner CRM data, drives upsells.
Time-to-value delta. Measure whether TTFV shortened after onboarding. A shorter TTFV means customers reach their "aha moment" faster, which directly predicts whether they'll renew.
Step 5: Run cohort analysis at 90-day intervals
Single-point measurements lie. Run cohort analysis at 90, 180, and 365 days post-onboarding to see how retention trends develop over time.
Split your customer base into two groups:
Pre-onboarding cohort: Customers acquired before your HubSpot onboarding (or re-onboarding) project. These accounts had inconsistent CRM data, manual processes, and limited lifecycle tracking.
Post-onboarding cohort: Customers acquired after onboarding, managed through the new workflows, lifecycle stages, and reporting structure.
Compare GRR, logo churn, TTFV, and NRR across both cohorts at each interval. The gap between them quantifies the retention impact of your onboarding investment.
If you're not seeing a gap by the 180-day mark, something in your onboarding didn't stick. Common culprits: properties that the team stopped maintaining, workflows that nobody adjusted after launch, or lifecycle stages that don't match how your customers actually behave.
Real example: How a 3,000-contact onboarding paid off
When Healthcare Brokers of America LLC (now Wellnest Insurance) came to webdew, they had a 3,000-contact database in disarray. Their team was new to HubSpot and needed help understanding the platform basics: importing data, creating properties, mapping contacts to companies, and building reports.
webdew's certified HubSpot experts organized the client's data, created custom properties, imported contacts and companies with proper associations, and segmented the database by inquiry type. They also completed full sales onboarding covering deals, tasks, meetings, and reporting.
Healthcare Brokers went from zero HubSpot adoption to a functional CRM with clean data, organized pipelines, and accurate reporting. As Bruno Nascimento from their team noted, "They got started on the projects right away and within a few days, I had a lot of it already in the works."
That speed matters. The faster a team reaches full CRM adoption, the sooner their customer data starts generating the lifecycle signals needed for B2B SaaS retention measurement.
What to do when the numbers don't move
Not every onboarding project delivers a retention lift on the first pass. If your scorecard shows flat or declining retention metrics after 180 days, look at these three areas:
Data hygiene. Run a property audit. If contact and company records have degraded since onboarding, your team stopped maintaining the system. Consider re-onboarding focused on daily data habits rather than initial setup. SaaS onboarding videos can reinforce these habits at scale without pulling your team into repeated live training sessions.
Workflow relevance. Workflows built during onboarding might not match how your business operates six months later. Review trigger conditions and enrollment criteria quarterly.
Team accountability. CRM adoption drops when nobody owns it. Assign a RevOps lead or customer success manager to own the retention scorecard and flag adoption regressions before they become churn problems.
Turning measurement into a retention system
Measuring HubSpot onboarding impact isn't a one-time exercise. The scorecard, cohort analysis, and lifecycle mapping described here should become a recurring operating rhythm. Monthly reviews at minimum. Quarterly, go deeper into cohort performance and look for patterns your monthly cadence missed.
B2B SaaS companies that connect their CRM platform services to measurable retention outcomes build a feedback loop: onboarding improves adoption, adoption improves data quality, better data enables churn prediction, and churn prediction drives customer success management interventions before accounts go silent.
That loop is what separates companies that use HubSpot from companies that grow with it.
Dive Into our
Client Testimonials
Listen to business owners like you share how we’ve helped them grow. Your story could be next!





.svg)

“Recently we reached out to Webdew for a website inside of HubSpot and they also did some mocking automation for us.”

“Webdew team was quite honest and quite easy to work with in terms of taking feedback implementing it, showing that it doesn’t happen again and things like making sure that it meets our expectations.”

“We worked with webdew to help us build our HubSpot website and they did an amazing job with it. They were very quick.”

“webdew has helped us optimize the sales and marketing processes, and this is automating a lot of processes.”

“Hi everyone my name is Kara and I work as a channel consultant at HubSpot Singapore. I’ve been working closely with webdew agency”

“Hi my name is Christian from OpenDoors Mortgage team and I’m in the mortgage business and just trying to work on new projects and kind of incorporating HubSpot for my operations”

“I’m one of the technology directors for Travelopia. We are the largest experiential travel company in the world. We’ve engaged webdew recently, not recently, it’s been about a couple of quarters now.”
“We worked with Chehak over the past several months to create a series of animated videos for an academic planner that we produce. And from the very beginning, she was absolutely professional and a pleasure to work with.”


6x
We helped clients multiply their website conversion rates through strategic design and UX optimization.
20%
Our marketing campaigns led to a 20% uplift in customer engagement across digital channels.
2K+
Delivered over 2,000 qualified leads through targeted funnels and smart automation.
120+
Our video content has earned 120,000+ views, driving brand awareness and audience retention.
“I recently had the pleasure of working with Chehak on a video demo project, and I was thoroughly impressed with her services.”
.svg)
